
The pace of this urban revolution is mesmerizing. Just 3% of the world’s population lived in cities in the early 1800s, compared to over 50% today.
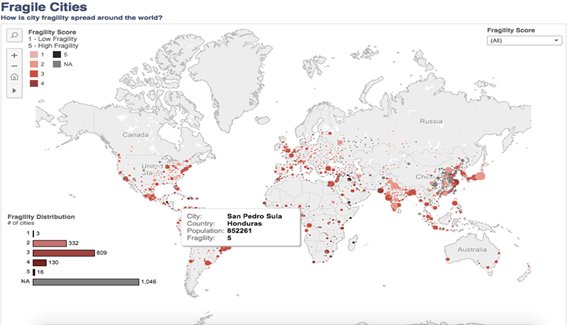
The fragile cities data visualization is a platform that tracks risks in over 2,137 cities with populations of 250,000 people or more. It includes a fragility scale (from 1-5, with 1 being low risk of fragility and 5 representing high risk). The scale is based on ten indicators that are statistically associated with instability. The idea is to provide mayors, planners, business people, and civil society groups access to annualized data on the ways in which urban fragility is distributed in upper-, middle- and lower-income settings. The early findings teach us a few lessons.
The data visualization demonstrates that just three megacities (over 10 million people) and three very large cities (with between 5 and 10 million people) are at high risk of fragility (4-5 on the scale). These include Baghdad, Dar es Salaam, Johannesburg, Karachi, Lagos and Shanghai.
But there are another 56 large cities (1-5 million people), 42 medium cities (500,000-1 million people) and 40 smaller cities (250,000-500,000 people) that are classified as “fragile”.
https://t.co/11RiKeyv7W